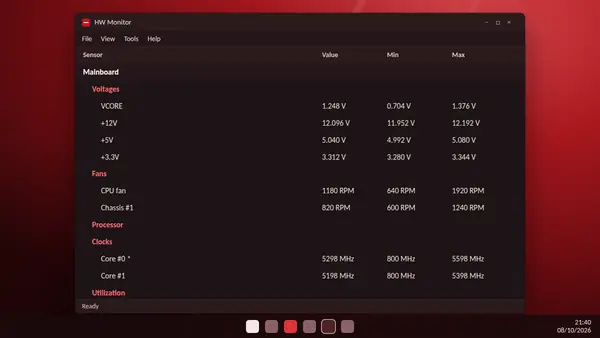
The Max column tells you how hot a part became. It does not tell you when, or for how long. For that you need a record over time. HW Monitor includes CSV logging for exactly this purpose.
Start and stop a log
- Open HW Monitor.
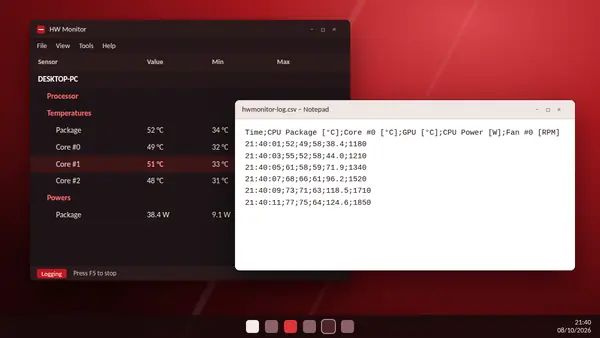
- Press F5. The status bar at the bottom of the window shows that logging is active.
- Use the PC as normal, or run the game or task you want to study.
- Press F5 again to stop.
What gets recorded
The log is a CSV file, short for comma-separated values. Each line is a moment in time, and each column is a sensor: temperatures, voltages, fan speeds, power, utilization and clock speeds.
Open the log in a spreadsheet
- Open the CSV file in Excel, LibreOffice Calc or Google Sheets.
- If everything lands in one column, use the import or Text to Columns option and choose the right separator.
- Select the time column and one sensor column, such as the processor package temperature.
- Insert a line chart.
You now have a picture of the whole session, with every spike in view.
What to look for
- Slow climb that never levels off: the cooling cannot keep up. Check dust and airflow.
- Sharp spikes that fall straight back: normal behaviour when a processor boosts for a short task.
- Clock speed dropping while temperature is at its peak: the processor is slowing itself down to stay cool.
- Fan speed flat while temperature rises: the fan curve may need adjusting in the BIOS.
Good moments to log
- Before and after cleaning a PC or replacing thermal paste.
- When testing a new cooler or a new case fan layout.
- When a game stutters after half an hour and you want to know why.
- When checking that a new build is stable.
A one-off report
If you only need a snapshot, the File menu can save the current monitoring data as a text file. It is handy for sending your readings to someone who is helping you.
Prefer to watch live?
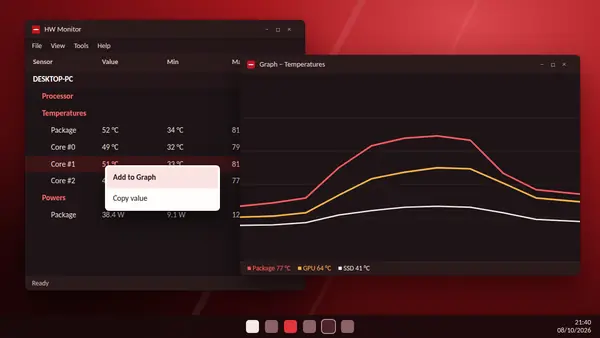
Real-time graphs draw the same data on screen while it happens. Right-click a sensor and choose Add to Graph.
Need more?
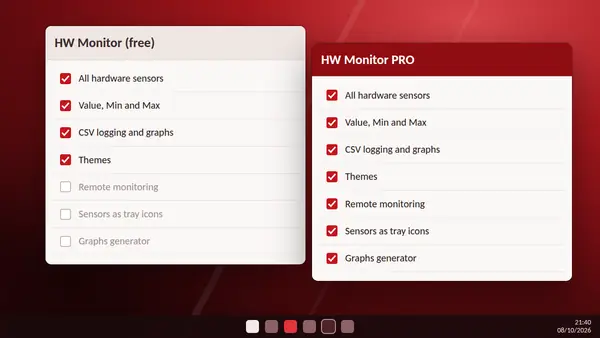
HW Monitor PRO adds more advanced logging, including a graphs generator. For most home use, F5 and a spreadsheet are enough.