HW Monitor

HW Monitor reads your PC's temperatures, voltages and fans

HW Monitor is a free hardware monitoring tool for Windows from CPUID. It reads the sensors in your processor, graphics card, mainboard and drives and shows them in one list. This independent guide shows you where to get HW Monitor safely and how to read it.

  • FreeNo account or licence key
  • Setup or portableInstall it, or run it from a ZIP
  • By CPUIDThe makers of CPU-Z
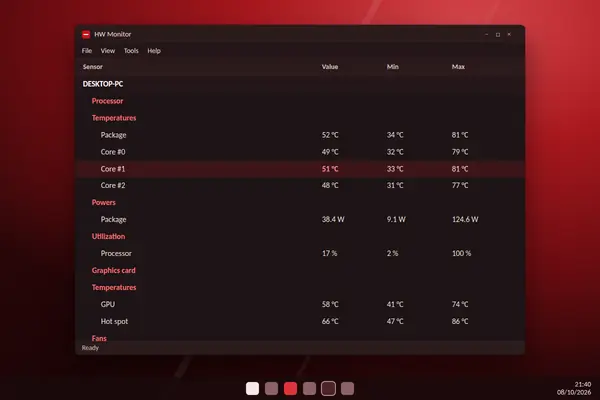
HW Monitor window listing processor and graphics card temperatures, power, utilization and fan speed with Value, Min and Max columns
An illustration of HW Monitor listing sensors with their Value, Min and Max readings.
THE ESSENTIALS

What is HW Monitor?

Understand your computer’s health through live hardware sensor readings—not guesswork.

A clearer picture of what happens inside your PC

HWMonitor is a Windows utility developed by CPUID, the maker of CPU-Z. It brings the readings reported by supported hardware sensors into one place, so you can see how temperatures, fan speeds, voltages and power draw behave while your computer is running.

01 / OBSERVE

Find out when heat builds up

A processor can look cool at the desktop yet become much warmer during gaming, rendering or a long video call. Compare current readings with the minimum and maximum values to understand the difference between idle and sustained use.

02 / COMPARE

Connect the numbers to symptoms

Unexpected fan noise, slower performance and sudden shutdowns can have different causes. Checking CPU and GPU temperatures alongside load and fan speed gives you useful evidence before you clean a cooler, adjust airflow or troubleshoot further.

03 / UNDERSTAND

Know what the tool cannot do

HWMonitor reports values; it does not automatically fix overheating or tune hardware. Sensor availability and accuracy depend on the motherboard, chip and firmware, so unexpected figures should be verified rather than treated as a diagnosis.

Good to know

The regular HWMonitor is available in installer and portable ZIP formats. Its main purpose is observation—not changing CPU clocks, voltages or fan curves.

Features that matter

What HW Monitor gives you, in the order most people use it.

  • Every main sensor in one list

    Temperatures, voltages, fan speeds, power, current, utilization and clock speeds appear in a single tree, grouped by device.

  • Processor and graphics card detail

    See package and per-core temperatures, core clocks and power for the processor, and temperature, hot spot, fan and load for the graphics card.

  • Value, Min and Max

    Each sensor shows its current reading with the lowest and highest values since you opened the program, so a test leaves a record behind.

  • Drive and battery health

    Reads SSDs and hard disks through S.M.A.R.T., including temperature and activity, and reports battery capacity and wear on laptops.

  • Real-time graphs

    Right-click any sensor and add it to a graph. Up to eight curves can share one graph, with colours you choose.

  • CSV logging

    Press F5 to record readings to a CSV file, then open it in a spreadsheet to study a whole session.

  • Four themes

    Switch between the classic light look, two dark themes and a blue theme from the View menu.

  • Setup or portable

    Install it like any program, or unzip the portable version and run it from a folder or USB stick.

Real-time graphs and extra themes arrived in version 1.64, and version 1.68 added new drive figures and made the program remember which sections of the tree you keep open.

PRACTICAL WALKTHROUGH

How to use HW Monitor

Six simple steps to gather useful readings and understand what they mean.

  1. Get the authentic copy

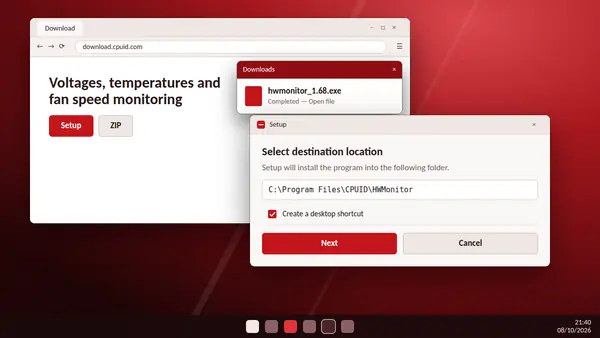
    Download HWMonitor from CPUID’s official website. Choose the Windows installer or the portable ZIP, according to how you prefer to run utilities.

  2. Open the appropriate version

    Install the application, or extract the ZIP and launch the executable that matches your system. Allow the sensor list a moment to populate.

  3. Locate the right component

    Expand your CPU and GPU entries. The temperature shown for the CPU package or GPU core is a more useful starting point than an unidentified motherboard reading.

  4. Understand the three columns

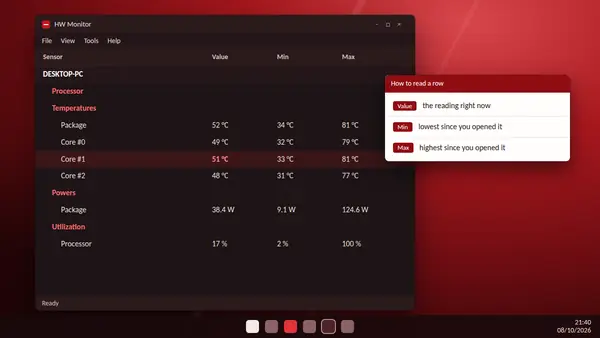
    Value is the current reading; Min and Max capture the range since monitoring began. Note the room conditions and what the PC is doing when you compare them.

  5. Check behavior under real work

    Keep the monitor open during a normal game, export or demanding task, then inspect the peak temperatures. Consistently high readings under load deserve a closer look at cooling and airflow.

  6. Record and compare results

    Use the logging or graph features available in your edition to observe changes over time. Compare tests under similar workloads; a single isolated spike rarely tells the full story.

Reading tip

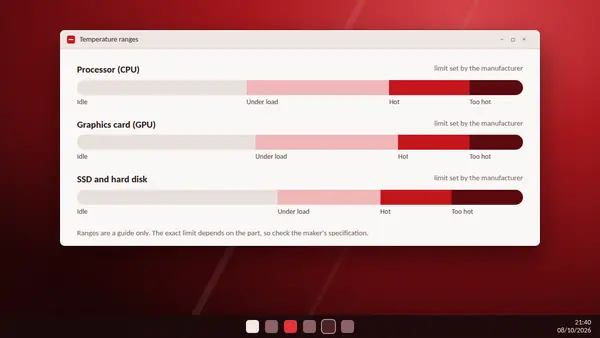
Temperature limits vary by processor and GPU. Check the manufacturer’s specifications before deciding that a particular number is unsafe.

SENSOR EXPLAINER

What HW Monitor monitors

Each number tells part of the story. Here is how to read the most useful groups.

°C

CPU and GPU temperature

Package, core and graphics temperatures help reveal how cooling performs at rest and under load. Available sensor labels differ by hardware.

Watch for sustained peaks, not just a momentary jump.
V

Voltage readings

Supported sensors may report CPU voltage and motherboard rails. Software readings can be mislabeled or inaccurate on some boards.

Confirm suspect readings before drawing conclusions.
RPM

Fan speeds

Visible fan RPM data can help determine whether connected cooling fans respond as the system heats up.

Some controlled or zero-RPM fans may show no speed at idle.
W

Power use

CPU package and compatible GPU power readings give context for heat output and changing workloads.

Supported sensors and reporting methods vary.
%

Load and clock speeds

Utilization and operating frequency readings help you compare what a component is doing with how much heat it produces.

Clock changes can be normal power-saving behavior.
SSD

Storage and battery

On compatible systems, drive temperature and selected health data or battery information may also be available.

Not every disk or laptop exposes the same metrics.

Missing sensors do not necessarily indicate a problem. The data HWMonitor can display depends on hardware support, drivers and firmware.

BALANCED VIEW

HW Monitor: pros and cons

A useful sensor dashboard, with some limits worth knowing before you rely on it.

+

What works well

  • Easy overview: CPU, GPU, fans and other supported sensors appear together.
  • Useful history: Minimum and maximum columns make it easier to spot changes during a task.
  • Lightweight option: The portable edition is practical for a quick check without a full installation.
  • Broad usefulness: Handy for investigating heat, fan noise or changes after a hardware upgrade.
−

What to keep in mind

  • No automatic repairs: It identifies readings but cannot solve a cooling issue by itself.
  • Hardware-dependent: Some sensors may be unavailable, incorrectly named or inconsistent.
  • Not a full stress test: You need a separate workload to see behavior under sustained demand.
  • Interpretation required: Safe temperatures and normal voltages vary across components.

Bottom line: HWMonitor is best used as a starting point for checking system health, alongside your hardware specifications and practical testing.

Download HW Monitor

The buttons below start the download straight away. The files come directly from the CPUID download server, and this site never hosts or changes them.

Free to use, with no account and no licence key. Choose the setup file for a PC you use every day, or the ZIP for a portable copy. Before opening the file, the publisher recommends checking its SHA256 checksum against the list on the CPUID website.

Files
hwmonitor_1.68.exe or .zip
Price
Free
Works on
Windows, 32-bit and 64-bit
Publisher
CPUID
Version
1.68
Source
Official CPUID server

System requirements

HW Monitor is light enough for almost any Windows PC.

Operating system
Windows, 32-bit and 64-bit
Setup version
Installs the right build for your PC
ZIP version
Portable, no installation
Current version
1.68, released in September 2026
Interface language
English
User account
Administrator rights
Price
Free. HW Monitor PRO is paid
Publisher
CPUID, makers of CPU-Z

HW Monitor is a Windows program. There is no version for macOS or Linux. The readings you get depend on your hardware: the program supports the common sensor chips used on mainboards, the thermal sensors inside modern processors and graphics cards, memory modules with thermal sensors, drives with S.M.A.R.T. and laptop batteries.

Administrator rights are needed because Windows does not let ordinary programs read hardware sensors directly. An internet connection is only needed to download the file.

HW Monitor compared with HW Monitor PRO

Both editions read exactly the same sensors. The paid one adds ways to use the readings.

FeatureHW MonitorHW Monitor PRO
All hardware sensorsYesYes
Value, Min and MaxYesYes
CSV logging with F5YesYes
Remote monitoring from a PC or Android deviceNoYes
Sensors as tray iconsNoYes
Graphs generatorNoYes
PriceFreePaid licence

For checking temperatures, testing a cooler or keeping an eye on a laptop, the free HW Monitor is all you need. HW Monitor PRO is worth a look if you look after several computers, want a reading always visible beside the clock or need graphs generated for reports.

Get more from HW Monitor

Six habits that turn a list of numbers into something useful.

  • Read Max after a sessionYou do not need to watch the window. Open HW Monitor first, play or work, then check the Max column.
  • Compare with the maker's limitEvery processor and graphics card has its own maximum temperature. Look it up before you worry.
  • Clear dust firstWhen temperatures creep up over the months, a clogged cooler is the usual cause.
  • Log long testsPress F5 before a long game or render and study the CSV file afterwards.
  • Update for new hardwareNew releases mostly add support for new processors and graphics cards. Update if a part is missing.
  • Collapse what you do not needClose the sections you never read. The program remembers the layout for next time.

HW Monitor guides

Step-by-step help for the jobs people use HW Monitor for most.

Read all guides

Questions about HW Monitor

Short answers to what people ask most often.

Is HW Monitor free?

Yes. HW Monitor is freeware. You can download and use it without paying, registering or creating an account. A separate paid edition, HW Monitor PRO, adds extra features.

Is HW Monitor safe to use?

Yes, when the file comes from CPUID, the company that also makes CPU-Z. The download buttons on this page link straight to the CPUID server, and you can confirm the file with its SHA256 checksum before opening it.

Does HW Monitor need to be installed?

Not necessarily. You can use the setup file, which installs the program, or the ZIP file, which is a portable copy that runs from any folder with no installation.

Which Windows versions does HW Monitor support?

HW Monitor runs on Windows in both 32-bit and 64-bit editions. The setup file installs the right one for your system automatically.

What does HW Monitor show?

It reads the main health sensors of a PC: temperatures, voltages, fan speeds, power, current, utilization and clock speeds, for the processor, graphics card, mainboard, memory, drives and battery.

What do Value, Min and Max mean in HW Monitor?

Value is the reading right now. Min and Max are the lowest and highest readings since you opened the program, which lets you check how hot a part became without watching the screen.

Why does HW Monitor show CPU utilization above 100%?

Since version 1.53 the program calculates processor usage the same way as Windows Task Manager but does not cap the figure. Values above 100% reflect turbo modes that push the processor beyond its base speed.

What does the star next to some cores mean?

The star marks the fastest cores of the processor. These cores can usually run at a slightly higher clock speed than the others.

Can HW Monitor control fan speed?

No. HW Monitor only reads sensors. Fan speeds are set in the BIOS or in the software supplied by your mainboard or graphics card maker.

How do I uninstall HW Monitor?

Remove it from Windows Settings under Apps, or choose Uninstall HWMonitor from the CPUID folder in the Start menu. A small CPUID folder with the settings file stays behind and can be deleted by hand.